The Speaker Lab

Grant Baldwin is the founder of The Speaker Lab, a collection of resources and coursework that teaches people how to become paid speakers. He offers a free podcast, one-on-one coaching, digital courses, and recently a book.
-
The Problem
Grant Baldwin had low website traffic even though he was the thought leader in his niche and had testimonials to prove his coursework produced results.
-
The Goal
My goal was to take control of his Facebook ads account and rework his messaging, create ads that simultaneously grabbed his audience, pulled them in, and ultimately lead to sales of his digital course. The target was a return on ad spend north of 250%
-
My Role
My responsibilities as the Advertising Manager included complete campaign management and implementation including strategy, user research, copy-writing, art direction, ad implementation, testing, and scaling.
Target Users
My primary research involved scraping data from Facebook’s Insights platform, plus Grant's previous client data and testimonials. I compiled this data and organized it, looking for patterns and common pain points. Next, I created an ad grid of potential people to target and their likely motivations for public speaking. This served as my foundation for ad targeting.

Avatars
After compiling their pain points, solutions, and beliefs, I created two avatars that would represent the initial users I would be targeting: Jemma, a successful entrepreneur who wants to leverage her expertise in dog training to teach people how to be in control of their pets and their own lives. And Chris, an insurance manager who wants to pursue public speaking to help people improve their lives by implementing productivity habits.

Avatar 1

Avatar 2
Ad Creation: A 3-Step Process
In the first phase, I had graphics created with accompanying headlines. These graphics stopped the users in place as they scrolled through Facebook and Instagram. This was the first step in the attention-gaining process. These graphics are tested against each other to see which got the highest impressions rate. The high impression rates equated to the graphic getting the most eyeballs at a reasonable cost per impression.

In the 2nd phase, I took the winning graphic and tested it with a combination of headlines. The purpose of each headline was to encapsulate a pain point or be solution-driven to the users who want to become paid public speakers. I measured the success of the headlines by their click-through rate. This metric told me what percentage of people resonated with the headlined, and clicked “see more” to read the body copy of the ad. At this point, I had a winning image and headline combination that led to a higher Click-through-rate. I also ranked the headlines for effectiveness so that I had alternative options in the event of ad fatigue.

In the 3rd phase, multiple versions of long-form ad copy were created and tested. Each version of the copy was story-based used to make Grant appear to be an expert in the field, showcasing the story he’s telling, and making the audience's struggles feel relatable and conquered by Grant. In order to judge the success of the ad copy, I looked for 2 key things: How many users click the links in the body copy, and ultimately how many course sales it led to.

Ad-copy
Results
At the end of each month, I created a report with Google Data Studios that outlines all the key metrics I tracked. It measured our success and helped guide my strategy for the following months. The beginning of September was our baseline to see how existing assets performed. By the end of November, we had found measurable success with new creative assets and targets.

Before:
When I took on Grant as a client, he had a monthly ad spend of $24k but was only 145% return on ad spend.
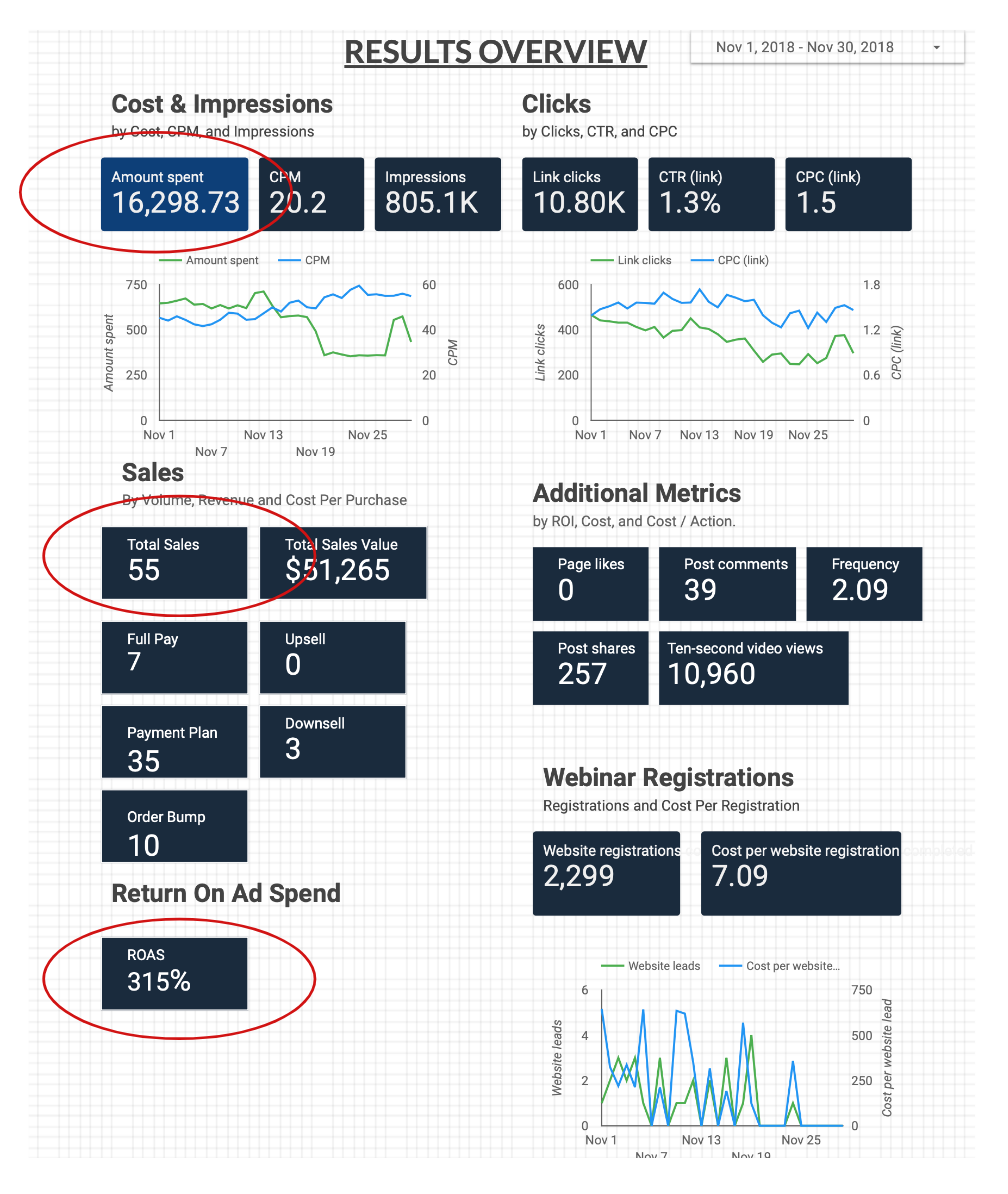
After:
After two months of testing, tweaking, and creating, I managed to more than double Grant’s Return on ad-spend. I accomplished generating more sales and total sales value while spending 1/3rd of what we spent at our inception.